|
We write a lot and that makes it hard to find the time to catch up on our latest research. To make our work easier to digest in 2018 we are breaking reports up into smaller bite size pieces and posting them here. This post is the fifth in a series of six highlighting key findings from our latest report The Pennsylvania Minimum Wage in 2018. Netflix down? Can’t read another grim news story?
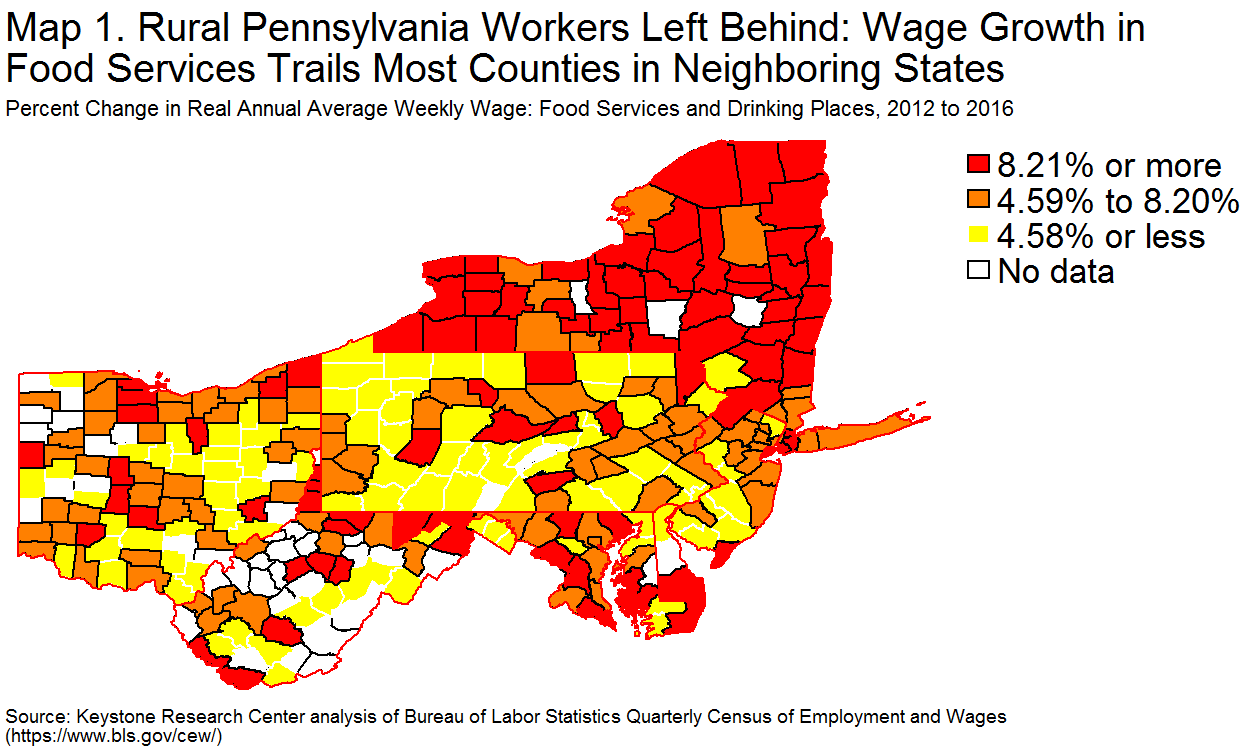
As we illustrated in our second post, while the minimum wage has lost ground to inflation here in Pennsylvania it has risen in every bordering state. What in turn has happend wages in a low wage industry like food services and drinking places?
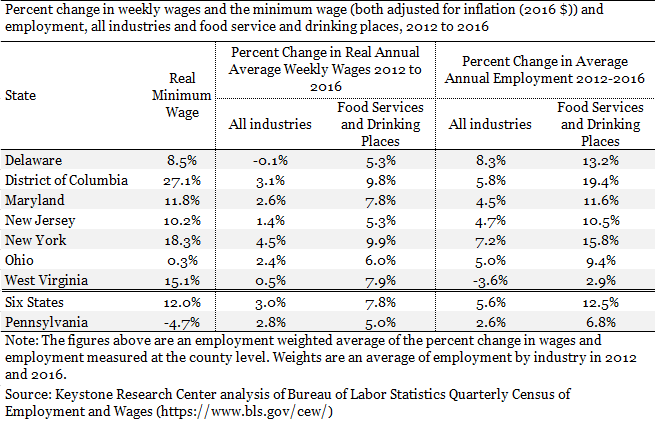
The map above presents the percent change in real annual average weekly wages by county in Pennsylvania and in six bordering states (Delaware, Maryland, New Jersey, New York, Ohio, and West Virginia) and the District of Columbia in food services (see the online technical appendix for employment and wage data by county). The counties shaded in red had the most growth in wages between 2012 and 2016 (2016 is the last full year of data available in our data source) and yellow the least. As the map makes clear, especially in New York, northern West Virginia, and Maryland there was more growth in wages in food services than in Pennsylvania. Overall in Pennsylvania, real wages in food services grew by just 5% while across the region they grew 7.8%. Not only has wage growth been stronger in the rest of our region where the minimum wage has increased, but so has employment growth.
Even as the purchasing power of the minimum wage rose 12% across the region, payroll growth in food services was up 12.5% compared to much slower growth of 6.8% in Pennsylvania, where the minimum wage lost 4.7% of its purchasing power.
|